Wednesday, June 4, 2014

BQ 7 : Unit V

In the process of finding the difference quotient we must understand slope and how a slope is found. The slope will give us two points for a line that will go through the function, that line is known as the secant line.
(http://clas.sa.ucsb.edu/staff/lee/Secant%20and%20Tangent%20lines.gif)
(http://0.tqn.com/d/create/1/0/9/p/C/-/slopeformula.jpg)
We have no points when finding the derivative of the difference quotient, we only have the x and y axis, although we should plot two points if we want to find the derivative of the difference quotient. X1 would be labeled as x and a value called h is added to reach x2 on the x axis making x2 as x+h. To find the y values we just plug in our x values into the function f(x) and our point for y1 would be f(x) and y2 would be f(x+h). Finally we plug in these points to the slope formula (y2-y1)/(x2-x1), so we would have f(x+h)-f(x)/x+h-x and the x's in the denominator would cancel leaving us with f(x+h)-f(x)/h. 

Resouces
http://0.tqn.com/d/create/1/0/9/p/C/-/slopeformula.jpg
http://clas.sa.ucsb.edu/staff/lee/Secant%20and%20Tangent%20lines.gif

Tuesday, May 20, 2014

BQ #6: Unit U Concepts 1-6


1. What is continuity? What is discontinuity?

Continuity is a continuous function and a continuos function has no holes, no breaks, and no jumps. A continuous function can be drawn with a single, unbroken, pencil stroke and the graph can also be continuous if the value and limit are the same.
(http://www.conservapedia.com/images/2/2f/Br-cont-function.png)
Discontinuity is when a graph is discontinuous, meaning that there is a hole in it, a break, a jump, and the value and limit are not the same. There are removable discontinuities, point discontinuity, and non-removable discontinuity, jump discontinuity, infinite discontinuity, and oscillating behavior. A point discontinuity has a hole in it, the limit, and the value can be above it or below it. A jump discontinuity is broken apart by a jump in the graph, meaning that the limits are approached differently left and right, a jump discontinuity cannot have two values. An infinite discontinuity has a vertical asymptote which results in unbounded behavior. Oscillating behavior is "wiggly" and there is no way in telling where the limit is reached in oscillating behavior since the graph is constantly moving up and down.
(http://dj1hlxw0wr920.cloudfront.net/userfiles/wyzfiles/4a69dec7-03e0-492f-ac16-4dcd555579c9.gif)


(http://dj1hlxw0wr920.cloudfront.net/userfiles/wyzfiles/44bad38c-431e-4382-8fe9-86303561b2a0.gif)
(http://www.vitutor.com/calculus/limits/images/0_268.gif)
(http://www.cwladis.com/math301/lecture%20images/infiniteoscillationdiscontinuityat1.gif)

2. What is a Limit? When does a limit exist? When does a limit not exist? What is the difference between a limit and a value?
A limit is the intended height of a graph. It exists when a certain limit is reached left and right, when there is a hole, and if the graph does not break at a given x-value. A limit does not exist when there is a jump discontinuity, when there is oscillating behavior, and when there is infinite discontinuity. The limit cannot exist at a jump discontinuity since the points are different left and right, a limit cannot exist at an infinite discontinuity because of a vertical asymptote that is present, and it cannot exist in oscillating behavior because the graph keeps moving up and down and there is no way to be certain where the limit touches the graph. The difference between a limit and a value is that the limit is the intended height and the value is the approximate height. 
3. How do we evaluate limits numerically, graphically, and algebraically?
A limit can be evaluated numerically by using a x-y table. We put the certain value that x is approaching in the middle and the limit it is approaching left and right of the table. Then we find the y values by plugging our equation into our graphing calculator and tracing it. Limits can be evaluated graphically by placing your fingers to the left and right of a limit and if your fingers meet then the limit exists, if your fingers do not meet then the limit does not exist due to different left and right, a jump discontinuity. Limits can be evaluated algebraically using direct substitution, the diving out/factoring method, and the rationalizing/conjugate method. Direct substitution is just plugging in the number and you might end up with a numerical answer, 0/#, or 0, #/0, the limit does not exist, or 0/0, indeterminate form. If you end up with 0/0 then you should try using the other two methods to solve the problem. The dividing out/factoring method is used when you have indeterminate form. Before using this method you should try direct substitution and if you end up with indeterminate form then go ahead and factor the numerator and denominator and cancel anything that needs to be canceled out. Once you finish canceling stuff out you should use direct substitution again. The rationalizing/conjugate method is just multiplying by the conjugate of the numerator or denominator depending on where the radical is and then you should FOIL. You should get something that cancels out and once some things are canceled out, try direct substitution again. That reminds me, you should use direct substitution before using this method as well.


Sources:
http://www.vitutor.com/calculus/limits/images/0_268.gif
http://dj1hlxw0wr920.cloudfront.net/userfiles/wyzfiles/44bad38c-431e-4382-8fe9-86303561b2a0.gif
http://www.conservapedia.com/images/2/2f/Br-cont-function.png
http://www.cwladis.com/math301/lecture%20images/infiniteoscillationdiscontinuityat1.gif
http://dj1hlxw0wr920.cloudfront.net/userfiles/wyzfiles/4a69dec7-03e0-492f-ac16-4dcd555579c9.gif

Monday, April 21, 2014

BQ#4: Unit T Concept 3

Why is a "normal" tangent graph uphill, but a "normal" cotangent graph downhill?
If we think back to the unit circle we can remember that tangent is positive in quadrant one, negative in quadrant two, positive in quadrant three, and negative in quadrant four. we should also remember that the ratio for tangent is sine/cosine or y/x. we should keep in mind that the asymptotes for tangent are where x, cosine, equals zero and that the asymptotes are at pi/2 and 3pi/2. an easy way to remember which direction tangent is graphed is that it is graphed according to which quadrants it is positive and negative in. cotangent
(http://hotmath.com/hotmath_help/topics/graphing-tangent-function/tan-graph.gif)
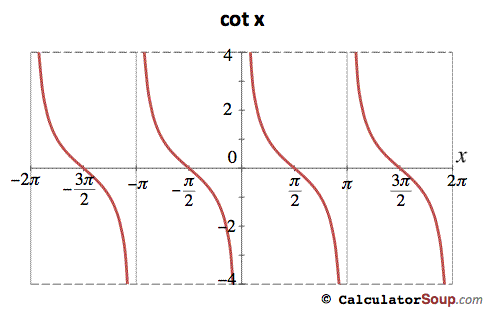
cotangent has asymptotes at zero, pi, and 2pi because sine is equal to zero and those three points are where cotangent is undefined. they are both positive above the x-axis and they are both negative below the x-axis but the reason for why cotangent's asymptotes go downhill is because the asymptotes and boundaries determine which direction the graph will go.
(http://www.mathipedia.com/GraphingSecant,Cosecant,andCotangent_files/image033.jpg)


BQ#3: Unit T Concepts 1-3

How do graphs of sine and cosine relate to each of the others?
  All of the graphs are graphed with an asymptote, they are all graphed when a point touches the x-axis. Asymptote are also based on sine and cosine. When they are graphed, sine and cosine continuously go up and down, the other four trig functions have an asymptote and continue but at some point only half of it is graphed and then a period is graphed and it repeats. The only graphs that change direction are tangent and contingent. Tangent is graphed as positive while cotangent is graphed as negative.


Tangent
The ratio for tangent is sine/cosine and an asymptote only exists for tangent when cosine equals zero.
Tangent's period is at pi and its parent asymptotes are at pi/2 and 3pi/2.
(http://www.regentsprep.org/Regents/math/algtrig/ATT7/otherg91.gif)

Cotangent
The ratio for cotangent is cosine/sine and the the asymptote only exists when sine is equal to zero. The parent asymptotes are 0 and pi; the reason why it is zero is because sine is equal to y on the unit circle and in this case sine (y/r) equals zero. this means that sine is equal to any value on the unit circle where y equals zero. 
(http://www.calculatorsoup.com/images/trig_plots/graph_cot_pi.gif)


Secant
Secant is the reciprocal of 1/cosine and an asymptote only exists when cosine is zero. when graphing secant there should be a parabola in the middle of one period. it is graphed from the middle point of the cosine graph that is graphed first. 
(http://www.calculatorsoup.com/images/trig_plots/graph_sec_pi.gif)
Cosecant
the reciprocal of cosecant is 1/sine and when sine equals zero cosecant is 1/0 which means that there is an asymptote because it is undefined. when cosecant is graphed there should be two parabolas in one period in between the asymptotes but they should be graphed from the lowest and highest points in the period. 
(http://www.calculatorsoup.com/images/trig_plots/graph_csc_pi.gif)


Friday, April 18, 2014

BQ#5: Unit T Concepts 1-3

Why do sine and cosine NOT have asymptotes, but the other four trig graphs do?

 The ratio for sine is y/r and the ratio for cosine is x/r. We know that in order for there to be an asymptote that the value has to be zero, or undefined. We also know that r equals 1 so sine is y/1 and cosine is x/1. The value of r is not zero, so we do not end up with an asymptote. The other four trig functions have asymptotes because their x or y value in the denominator is not 0, it can vary depending on the values of x and y.

(http://ramanujan.math.trinity.edu/rdaileda/teach/m1312f08/invtrig/7.jpg)

(http://www.analyzemath.com/trigonometry/graph_cosecant.gif)
(http://www.mathipedia.com/GraphingSecant,Cosecant,andCotangent_files/image033.jpg)

(http://www.mathamazement.com/images/Pre-Calculus/04_Trigonometric-Functions/04_06_Graphs-of-Other-Trig-Functions/secant-graph.JPG)


Thursday, April 17, 2014

BQ#2: Unit T Concept Intro

1. How do the trig graphs relate to the Unit Circle?
Trig graphs relate to the unit circle because of ASTC. Whether the quadrant is positive or negative all depends on whether it is sine, cosine, tangent, or cotangent. An example would be if it is sine, then the first quadrant would be positive, the first quadrant is always positive, the second quadrant would be positive because that's the quadrant where sine is positive, and the third and fourth quadrants would be negative.
http://www.analyzemath.com/trigonometry/graph_sine.gif


Period
The period of sine and cosine is 2pi because that is how many units on the x-axis they cover while going through one cycle. The period of cotangent and tangent is pi because they cover pi units on the x-axis while going through one cycle.

Amplitude
sine and cosine have restrictions that they can only be between 1 and -1. One and negative one are also the lowest and highest points when being graphed. Cosecant, tangent, cotangent, and secant do not have an amplitude.

Thursday, April 3, 2014

Reflection #1: Unit Q: Verifying Trig Identities

1. Verifying a trig function means to get one side of the problem to equal the other. Think of it as proofs from Geometry. It's related to it because identities are being used to get the final answer. When you are verifying a trig function you should know what your identities are or else you're going to have a bad time.
2. The most helpful tip was that you can't divide a trig function by another trig function and that when in doubt, square the function. Squaring the function is a lot more work because of the extraneous solutions but it's better than staring at the paper wondering what to do next. The most important tip is to memorize all of the identities so it'll make verifying it a lot easier.
3. When I am given a trig function to verify I first look at the identities to see what I am going to use. I also check if I am going to have to multiply to get the least common denominator or when I have to move something over to the other side to make the function equal 0. When i have a function that is squared I take out the GCF and I usually end up with a Pythagorean Identity. If I'm stuck, I square the functions to see if I can go somewhere with that.